


Introduction
Making the right call in your warehouse often comes down to how quickly you can move from data to action. With so many numbers and trends competing for attention, it’s easy to lose time interpreting what they really mean. In this post, you’ll learn how Rebus’ new AI Dashboard Insights feature gives you the story behind your metrics with clear next steps, so you can make confident decisions, faster.
Table of Contents
In today’s warehouses, dashboards are the backbone of decision-making. They consolidate data into clear, real-time views of what’s happening on the floor. But even the best dashboards still require you to pause and interpret what those insights mean for your next move.
That’s where AI Dashboard Insights comes in. With a single click, Rebus takes the insights already in your dashboards and translates them into clear, decision-ready intelligence. Instead of asking “Why is my outbound productivity dropping this week?” you get answers instantly—helping you move from awareness to action faster than ever.
Why We Built AI Dashboard Insights
AI is everywhere. From the apps on our phones to the tools we use at work, it’s become part of how we navigate daily life. At Rebus, AI isn’t brand new. Earlier this year, we introduced AI Trend Forecasting, which helps leaders anticipate labor needs, inventory demand, and throughput challenges.
Now, with AI Dashboard Insights, we’re building on that foundation. We’re bringing real-time intelligence directly into your dashboards, directly into the flow of real-time data from WMS and other disparate systems. With AI Dashboard Insights, we’re making warehouse analytics practical, actionable, and immediate—so the decisions you make every day become simpler, clearer, and more effective.
The timing couldn’t be more important. Modern supply chains generate enormous amounts of data every day. Each facility has multiple systems, tools, and processes feeding into dashboards. That’s one of Rebus’ biggest strengths: unifying disparate systems and surfacing insights in real time. But with so much information available, leaders sometimes find themselves asking: Which trend matters most? What deserves my attention right now?
By analyzing all the context already in your dashboards, AI Dashboard Insights brings the most important takeaways to the surface—so you can quickly see patterns, understand anomalies, and decide what to do next.
At its core, this feature is about helping warehouse and supply chain leaders focus on what matters most. Dashboards show you the insight. AI Dashboard Insights explains what it means.
How AI Insights Works
Using advanced language models trained to analyze warehouse data, AI Dashboard Insights interprets the context of your dashboards in real time. Here’s what that means in practice:
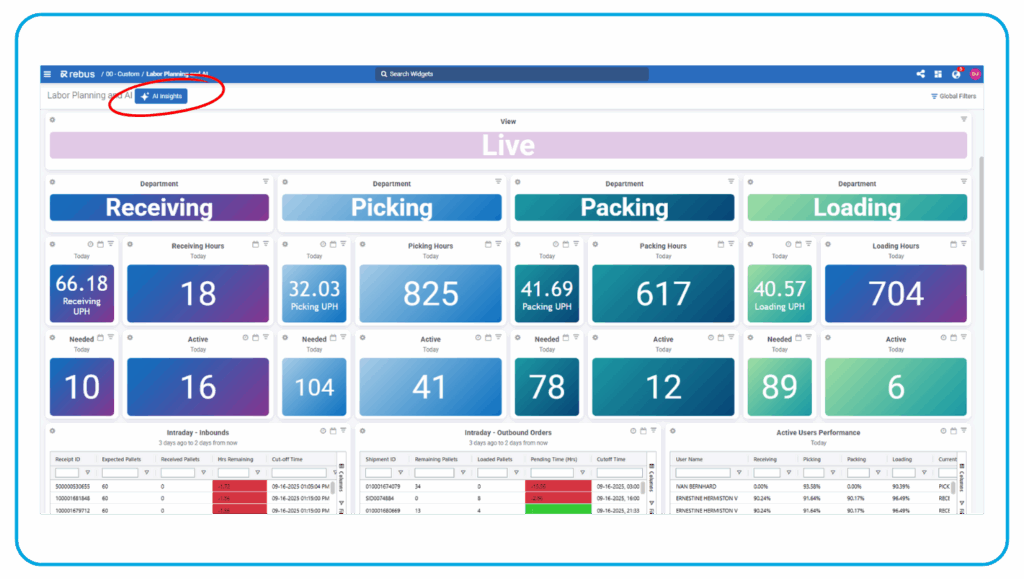
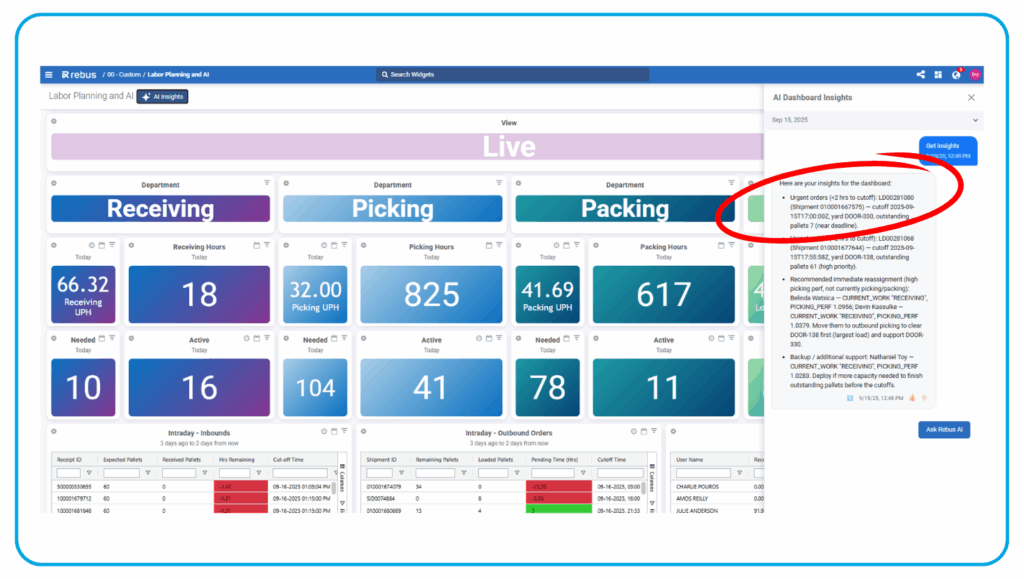
- Click the AI Insights Button
You’ll see the AI Insights option next to any dashboard name in Rebus.
- Get Instant Insights
An AI agent opens in the corner of your screen with a concise summary of what’s happening in your data. Think of it as a conversation with your dashboard—one where you ask, What’s really going on here? and get a clear answer in seconds.
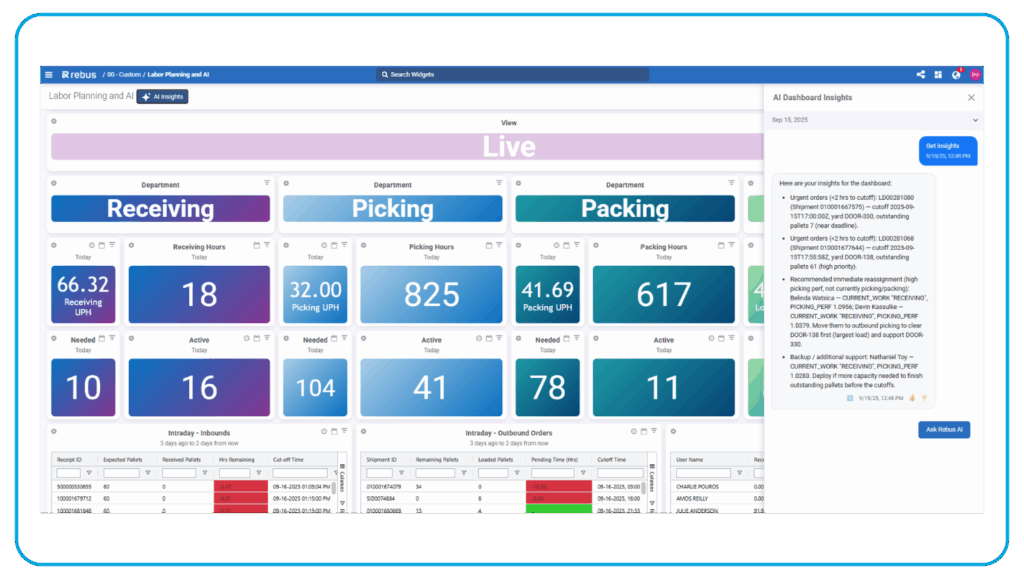
- See Recommendations You Can Act On
Insights aren’t just descriptions. You’ll also see recommended next steps—practical suggestions you can act on right away to address anomalies or take advantage of opportunities.
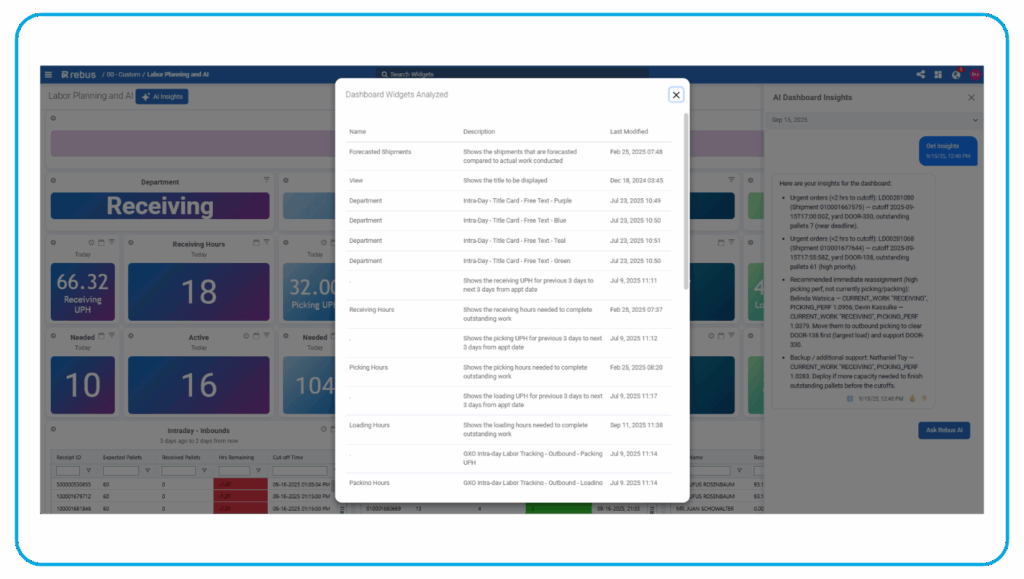
- Track Your Requests
Every AI interaction is saved. That means you can revisit past insights whenever you need, whether for reporting, coaching, or follow-up actions.
What Your Warehouse Can Do with AI Insights
With this release, AI Dashboard Insights delivers four core capabilities:
- One-Click Summaries: Surface the meaning behind trends and anomalies in seconds.
- Context-Aware Analysis: Always aligned with the filters and widgets in your dashboard.
- Real-Time Recommendations: Actionable guidance you can apply immediately.
- Saved Insight History: A running log of insights and actions you can revisit anytime.
In short, dashboards already give you visibility—AI Dashboard Insights adds meaning and direction.
Book a free demo now
See how Rebus unifies labor, inventory, and automation data to deliver real-time visibility, smarter forecasting, and actionable warehouse insights.
- Real-time visibility across labor, processes, and inventory
- AI-powered forecasting to anticipate change and plan ahead
- Custom dashboards for faster, more confident decisions
Real-World Scenarios
While Dashboards already show you the key data points, AI Dashboard Insights takes the next step by explaining what those numbers mean and suggesting practical actions. Here are a few examples of how this plays out in real operations:
- Labor Management: A dashboard highlights a dip in productivity, but the root cause isn’t immediately clear. AI Insights connects the drop to unplanned absences and recommends rebalancing staff from other zones. Instead of digging through attendance and shift records, supervisors can act quickly to keep throughput on track.
- Indirect Time Analysis: At first glance, indirect labor time looks minor. But AI Insights spots that over 80% of it comes from one activity: RF sign-on. By surfacing that concentration, it highlights a clear opportunity: streamline or automate the process to reclaim hours for productive work. The result is less wasted time and more labor capacity where it matters.
- Throughput Monitoring: Rising pick rates are a positive sign for most leaders. But AI Insights goes deeper, noticing that mis-picks are climbing at the same time. This early warning helps prevent a short-term win from becoming a long-term setback, allowing managers to adjust training or processes before fulfillment errors ripple downstream.
- Capacity & Utilization: In one facility, dashboards show utilization at 90% with solid throughput but labor performance just over 83%. AI Insights flags the limited capacity headroom (only about 10%) and explains the risk: during a demand spike or unexpected absenteeism, service levels could be missed. It recommends surge staffing, overtime planning, or scenario testing to avoid bottlenecks when volumes climb.
- Measurement Gaps: A workforce snapshot reveals 221 measured hours but more than 122 unmeasured hours—over a third of total time unaccounted for. AI Insights brings this gap to the surface and recommends capturing or reclassifying those activities. The result is better visibility into performance and greater accountability across the workforce.
- Cost Performance: A single-day snapshot shows total labor costs of $5,323 over 355 hours (about $15 per total hour or $24 per measured hour). With utilization at 90% and performance at 83%, AI Insights sees clear upside. By cutting avoidable indirect time and targeting performance improvements, managers can reduce cost per productive hour. It also recommends monitoring trends over time to validate the opportunity before making big changes.
With each of these, dashboards surface the insights. AI Dashboard Insights explains what they mean and points you toward the right next step.
Part of a Bigger Step Forward
AI Dashboard Insights headlines our recent Rebus release, which also includes:
- A new Rebus Mobile App for Android so associates can log activities and check dashboards on the floor.
- Chart Designer upgrades for more flexible, polished visualizations.
- Simplified activity logging with fewer unnecessary fields and better time tracking.
- Dashboard and admin tools that make it easier to manage widgets, filters, and users.
Taken together, these updates make Rebus more powerful, more mobile, and more user-friendly than ever. Read the full press release here.
What’s Next
AI Dashboard Insights is just the beginning of our journey to apply AI to warehouse data in meaningful ways. We see enormous potential for large language models in supply chain operations, and our roadmap includes even more AI-driven capabilities to help leaders move faster, smarter, and with greater confidence.
For now, we’re excited to see how you use AI Dashboard Insights in your daily work. Whether you’re a supervisor needing quick answers or an executive steering strategy, this feature puts insights directly in your hands.
As I’ve said before: AI Insights is about removing the friction between your data and your decisions. Now, instead of waiting or guessing, you can see the story behind your numbers instantly and take the right action with confidence.
Ready to See It in Action?
AI Dashboard Insights is just one of the ways Rebus is helping supply chain leaders move faster and smarter. Every warehouse has its own challenges, and the best way to understand the impact is to see it with your own data and workflows.
We’d love to show you how Rebus can uncover the meaning behind your metrics and help you make confident decisions in real time.
Book a demo today and see how Rebus can transform your warehouse operations.